To create graphs from data, first navigate to a dataset as described in the Overview.
Once at a dataset:
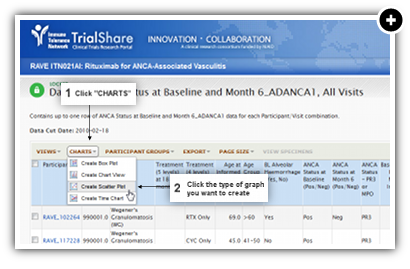
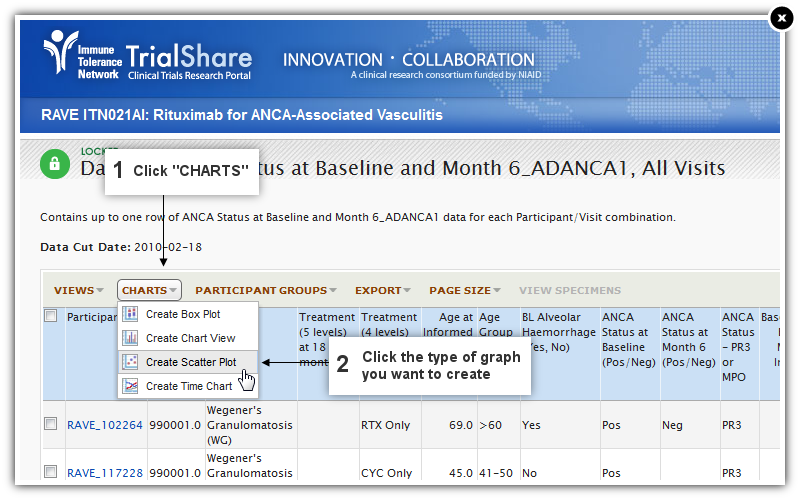
- Click "CHARTS."
- Click the type of graph you want to create.
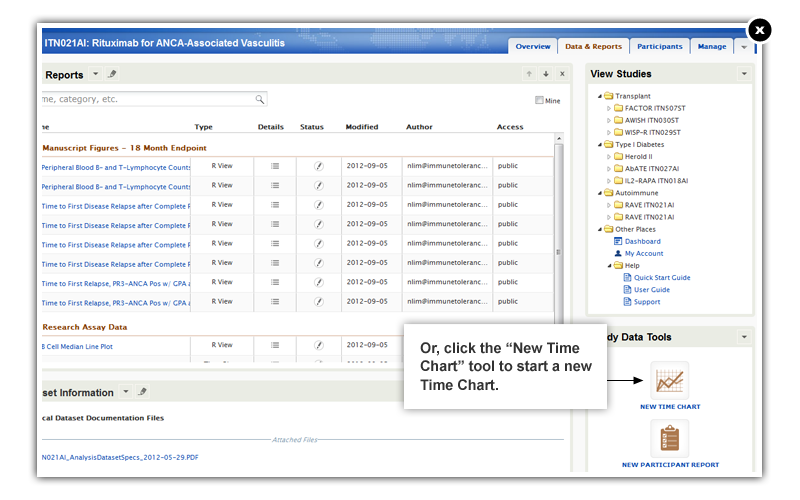
TIP: You can also start a new Time Chart by clicking New Time Chart in the right sidebar, without going to a dataset first.
More instructions on how to use each charting and graphing tool can be found in the User Guide.